
Email us
Career Outcomes
Master of Information
Career Outcome Report
2019–Present: These data were collected during students’ final semester in the Master of Information (MI) program, before degree completion, providing an early snapshot of career outcomes. Many students were already employed in information-related positions while completing their degree.
Employment Outcomes
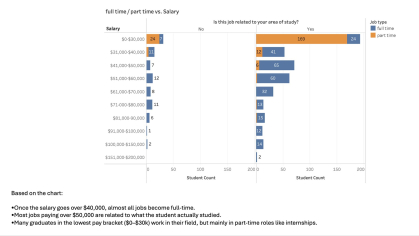
The results below show a strong connection between students’ areas of study and their employment outcomes. Full-time respondents are concentrated in the $41,000–$70,000 salary range, with additional respondents earning above $70,000. Because many respondents were still completing their degrees when the data were collected, these salary levels may increase following graduation. Part-time employment is primarily concentrated in positions paying under $30,000, and relatively few respondents reported working outside their field of study.

The MI program prepares graduates for a diverse range of careers across libraries and information organizations, technology, data and analytics, user experience, knowledge management, and leadership. The job titles shown here illustrate the breadth of roles held by MI graduates and demonstrate how the skills developed through the program can be applied across industries and professional settings.
Real-World Results
83%
Of our graduates are employed in careers related to their field of study
Master of Information Concentration Breakdown
Students pursue a broad range of academic interests within the MI program. While Library and Information Science represents the largest concentration (46%), more than half of students pursue other areas, including Archives & Preservation, School Librarianship, Data Science, Human-Computer Interaction, and Technology, Information & Management. This distribution highlights the interdisciplinary nature of the MI degree and the variety of professional directions available to students.

Have Questions?
We're here to help.